We have examined one day of content moderation by social media platforms in the EU. This report examines how social media platforms moderated user content over a single day. It analyzes whether decisions were automated or manual, the visibility measures applied, and which content categories were most subject to moderation by specific platforms on that day. You can read the complete analysis here online or download the report.
Suggested citation:
Dergacheva, D., Kuznetsova, V., Scharlach, R., & Katzenbach, C. (2023): One Day in Content Moderation: Analyzing 24h of Social Media Platforms’ Content Decisions through the DSA Transparency Database. Lab Platform Governance, Media, and Technology (PGMT). Centre for Media, Communication and Information Research (ZeMKI), University of Bremen. https://doi.org/10.26092/elib/2707.
According to the Digital Services Act (DSA) legislation, Very Large Online Platforms (VLOPs) and two search engines (VLOSEs) with over 45 million are mandated to submit daily reports on their content moderation decisions. The DSA transparency database, which has been operating since September 2023, currently holds over 735 billion content moderation decisions provided by these tech companies to the EU Commission.
The team at the Platform Governance, Media, and Technology Lab at the Center for Media, Communication, and Information Research (ZeMKI), University of Bremen, examined one day of content moderation by social media platforms in the EU. This report examines how social media platforms moderated user content over a single day. It analyzes whether decisions were automated or manual, the visibility measures applied, and which content categories were most subject to moderation by specific platforms on that day.
The dataset was obtained from the DSA’s database daily reports page. We selected only social media platforms from all the designated VLOPs reporting their decisions. As of now, these platforms include Facebook, Instagram, TikTok, YouTube, X (formally known as Twitter) Snapchat, Pinterest, and LinkedIn.
The complete one-day set downloaded on November 5, 2023, encompassed 7,143,981 decisions. Our final dataset, focusing solely on social media, included 2,195,906 content moderation decisions across 37 variables. Notably, for six of these variables, including content language and monetization, information was not provided on that day.
In the latest transparency reports under DSA article 24 (2), social media platforms provided the following figures of users on Graph 1 (in millions of users):
Figure 1: Number of active monthly users in the EU, in millions (as reported by platforms under DSA, 2023)
It is important to note that it is unclear whether all the platforms provided numbers for only active users. For example, YouTube, X and LinkedIn specifically differentiate ‘’logged-in’ and ‘logged-out’ users, and those numbers only represent the ‘logged-in’, but TikTok, Facebook, Instagram and Snapchat do not specifically note this.
In addition, Pinterest counted not only users from the EU but also from Russia and Turkey for the purpose of reporting in its DSA’s biannual number of members report.
You can download the full report here (in PDF) or read it by sections:
- How many moderations decision were taken by each platforms in one day
- The numbers of automated and manual decisions by each platform
- Decision visibility (or what actions did platform take in content moderation)
- Explanations on ‘other’ category of moderated content by platforms X, TikTok, Pinterest and LinkedIn
- Content type and category (or what kind of content was moderated?)
- Visibility decisions by content category: what moderation practices are more typical for certain categories of content
- Keywords indicated by platforms as category for moderation
- Duration of the suspension of services
- Date of moderated content creation
- Sources for content moderation decisions
- Territorial scope of decisions on moderated content
- Conclusion
The Lab “Platform Governance, Media and Technology” at the Center for Media, Information and Communication Research (ZeMKI), University of Bremen, will continue studying content moderation reports provided under the DSA, making it a longitudinal study. We invite other individual researchers and research groups for cooperation on assessment of DSA’s effect on governance by platforms.
Content moderation decisions
How many content moderation decisions did each platform make on one day? Table 1 displays the number of content moderation decisions made on November 5, 2023, by each platform
| platform_name | moderated content for one day |
| 903183 | |
| 634666 | |
| TikTok | 414744 |
| YouTube | 114713 |
| 111379 | |
| Snapchat | 11505 |
| X | 5384 |
| 332 | |
| Total | 2195906 |
Table 1: total numbers of content moderation decisions by social media platforms in one day (05.11.2023)
The total number of all content moderation decisions in the EU by these VLOPs was over 2 million cases in one day.
By far, Facebook reported the highest number of moderations, with 903,183 decisions. Discussing Pinterest’s numbers is challenging, as they appear to include users and content from outside the EU, including Russia and Turkey. Nevertheless, their moderation decisions totaled 634,666. TikTok was third with 414,744 decisions. YouTube and Instagram reported similar figures for the day, with 114,713 and 111,137 decisions, respectively. Snapchat accounted for 11,505 of these decisions. X and LinkedIn reported the fewest decisions: 5,384 and 332, respectively.
Figure 2 represents the share of content moderation decisions made by platforms, in %.
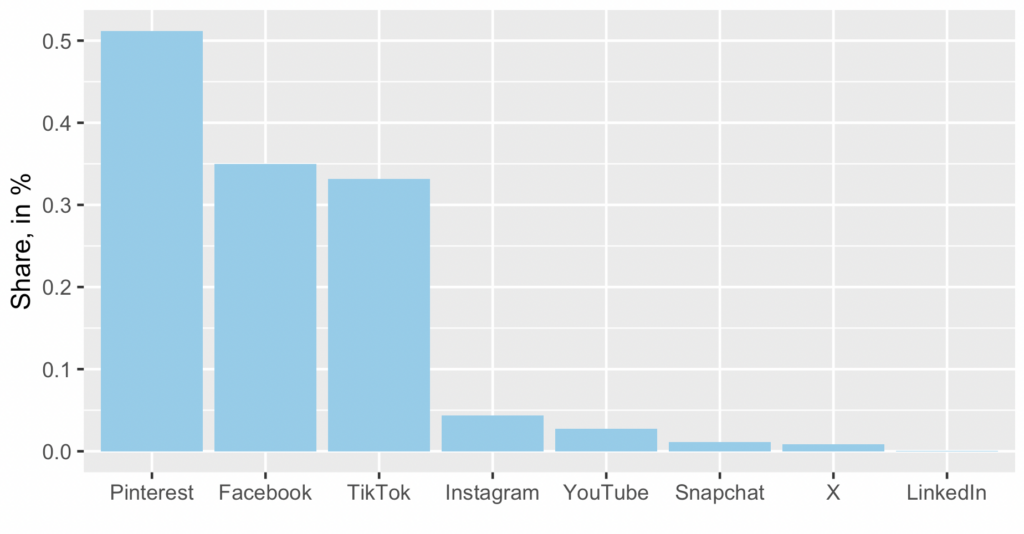
Figure 2: Moderations per user number by platform, in %.
Automated and manual detections
Platforms report whether detection was automated and categorize the types of automation used: fully automated, partially automated, or not automated. Approximately 68% of all detections across the platforms were automated. Table 2 provides more detailed numbers for each platform.
One particularly unusual finding is that X reported using only human moderation for its decisions. As a result, there were just over 5,384 such decisions, a number relatively low compared to other platforms with a similar user base in the EU. However, LinkedIn reported even fewer cases for the day, with only 332 total cases of moderation.
| platform_name | AUTOMATED__PARTIALLY | AUTOMATED_FULLY | NOT_AUTOMATED |
| 895579 | 0 | 7604 | |
| 630557 | 2966 | 1143 | |
| TikTok | 0 | 375250 | 39494 |
| 105595 | 0 | 5784 | |
| YouTube | 13906 | 45840 | 54967 |
| Snapchat | 0 | 2712 | 8793 |
| X | 0 | 0 | 5384 |
| 0 | 93 | 239 |
Table 2: Type of decisions taken by platforms on content moderation
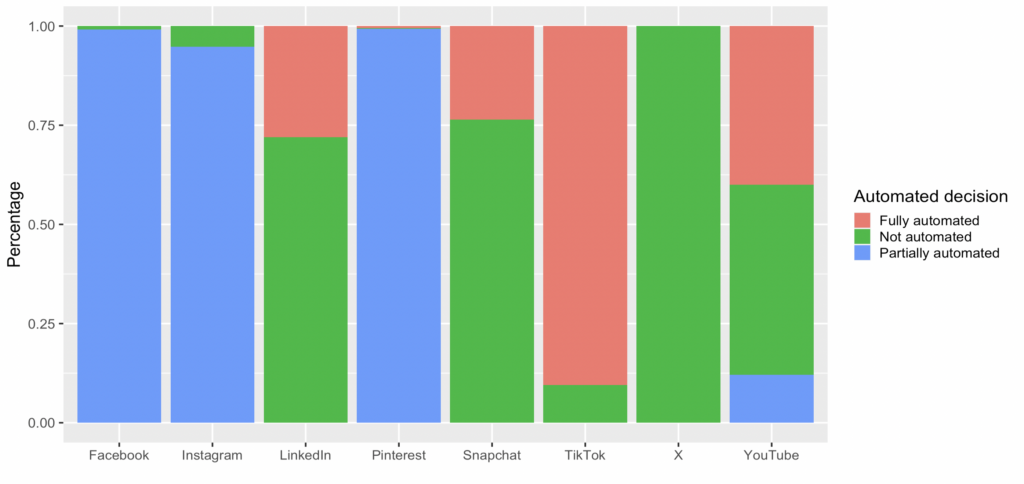
Figure 3: Proportion of different automated and manual decisions by platform, in %.
It is important to note here that Pinterest, although it declares its decisions as ‘manual’ in the daily reports, declared them as ‘hybrid’ in the bi-annual DSA transparency report and described ‘hybrid’ as essentially automated decisions based on machine learning. Snapchat declares that the absolute majority of its moderation decisions was manual, 9540 to 1965. X did not declare any automated decisions on that day, so all of the decisions were taken by human moderators. However, there were only 5384 of them, in contrast with, for example, Facebook that reported over 7000 manual decisions in addition to 895579 moderated as ‘partially’ automated. We can note that what Meta describes as ‘partially automated’ may once again be explained by what they say in bi-annual DSA transparency reports as AI powered decisions which may identify and remove or demote content:
“We also use artificial intelligence (AI) to augment and scale our human review capacity with appropriate oversight: like with the matching technology, when confident enough that a post violates one of our Community Standards, the artificial intelligence will typically remove the content or demote it. We also use artificial intelligence to select the content for human review on the basis of severity, virality, and likelihood of a violation. As with matching technology, artificial intelligence operates on URLs, text, images, audio, and videos. Unlike technologies that can only match violations they’ve seen before, artificial intelligence has the potential to identify certain violations it has never seen before.” (Meta Facebook DSA bi-annual transparency report, p. 9).
We have further checked X on different days of reporting to the DSA database, October 4th and October 10th, and both days they once again did not report any automated decisions, reporting 7592 and 3611 manual decisions.
Decision visibility (or what action did platforms take?)
Platforms specified six categories for visibility decision: (1) removed, (2) labeled, (3) disabled, (4) demoted, (5) age restricted content, or (6) other. For some content, however, information was not provided. Among all platforms, the most popular decision was to remove content, while least common decision implied content labeling.
Many researchers (e.g. Savolainen, 2022, Cotter, 2023) call decisions like ‘demotion’ or ‘restricting recommendations’ ’shadowbanning (unless the users were explained that their content was demoted or not eligible for recommendations). All platforms, apart from YouTube, reported those. We would need to compare this report with other days in order to understand whether YouTube does not, contrary to the evidence talked about in Gillespie (2022) use demotion techniques of moderation at the moment (or perhaps any more). As Gillespie (2022) highlighted:
“Platforms are, understandably, wary of being scrutinized for these policies—either for being interventionist and biased, or opaque and unaccountable. Some platforms have not acknowledged them publicly at all. Those that have are circumspect about it. It is not that reduction techniques are hidden entirely, but platforms benefit from letting them linger quietly in the shadow of removal policies. So, despite their widespread use, reduction policies remain largely absent from news coverage, debate, policymaking, and even much of the scholarly conversations about content moderation and platform governance” p. 2
Now probably for the first time in the history of social media platforms research, we can actually see just how much the ‘demotion’ is used, although still a lot of content moderation decisions are hidden under the category of ‘other’ (Tables 3 and 4, and Figure 4), which is further explained by only three platforms.
| Visibility decision | N of cases |
| Removed | 831257 |
| Not specified | 750754 |
| Other | 517501 |
| Disabled | 40377 |
| Demoted | 39421 |
| Restricted | 9802 |
| Labeled | 6794 |
Table 3: Total amounts of different visibility decisions.
| platform_name | NA | OTHER | REMOVED | DEMOTED | DISABLED | AGE_RESTRICTED | LABELLED |
| 659739 | 0 | 198983 | 37659 | 8 | 0 | 6794 | |
| 255 | 440714 | 193697 | 0 | 0 | 0 | 0 | |
| TikTok | 10522 | 71358 | 325646 | 0 | 0 | 7218 | 0 |
| 77803 | 0 | 31814 | 1762 | 0 | 0 | 0 | |
| YouTube | 148 | 0 | 77338 | 0 | 34643 | 2584 | 0 |
| Snapchat | 2287 | 0 | 3496 | 0 | 5722 | 0 | 0 |
| X | 0 | 5380 | 0 | 0 | 4 | 0 | 0 |
| 0 | 49 | 283 | 0 | 0 | 0 | 0 |
Table 4: visibility decisions by platforms
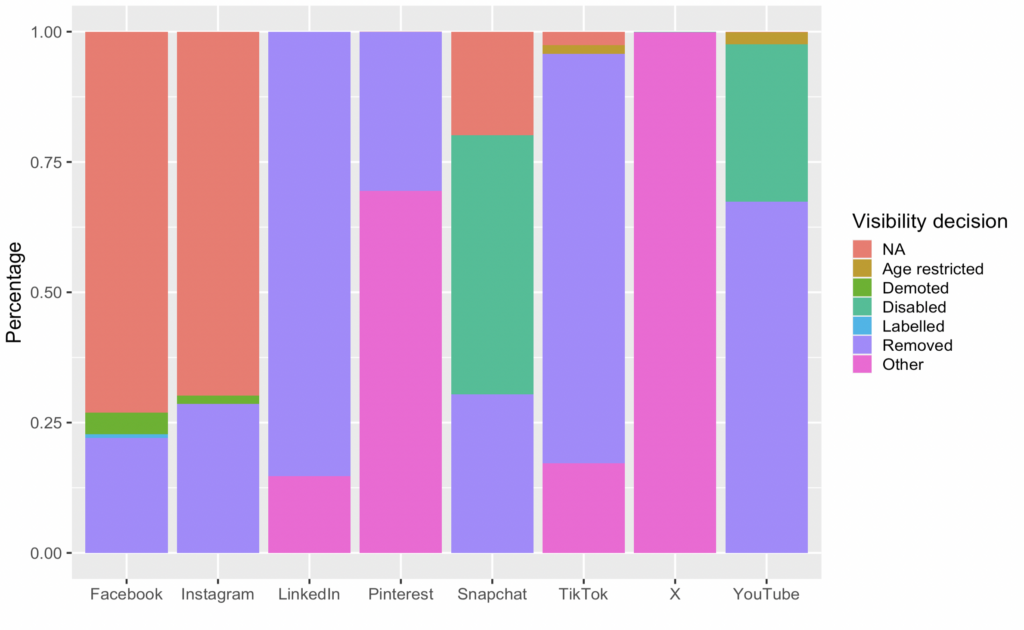
Figure 4: Proportion of different types of visibility decisions by platform in %.
Platforms X, TikTok, Pinterest and LinkedIn provided some explanations on ‘other’ category of moderated content:
| platform_name | NA | Nsfw | Bounce | Suspend | Deactivate | Ban |
| X | 4 | 3718 | 1117 | 523 | 19 | 3 |
Table 5: X platform explanation of visibility decisions
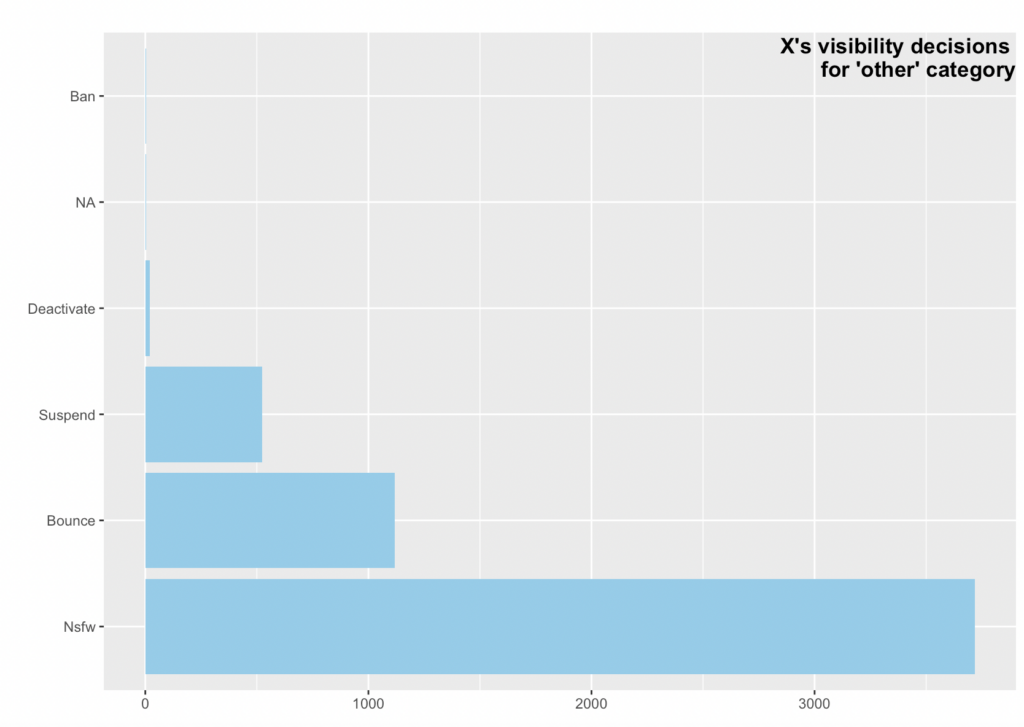
Figure 5: Visibility decisions for ‘other’ category reported by X.
NSFW, means ‘Not safe for work’’ and is an Internet slang or shorthand used to mark links to content, videos, or website pages the viewer may not wish to be seen viewing in public (e.g. Tiidenberg, 2016). We could suggest that it probably means that most of the content moderated by X (69%) was links to inappropriate content, although this can only be clarified by the platform itself. What ‘bounced’ content means needs to be explained by the platform.
| platform_name | NA | Video not eligible for recommendation in the For You feed | LIVE not eligible for recommendation and restricted in search results for 10 minutes | LIVE not eligible for recommendation and restricted in search results | Video not eligible for recommendation in the For You feed, and visibility restricted in search results |
| TikTok | 343386 | 39644 | 26067 | 5523 | 124 |
Table 6: TikTok platform explanation of visibility decisions
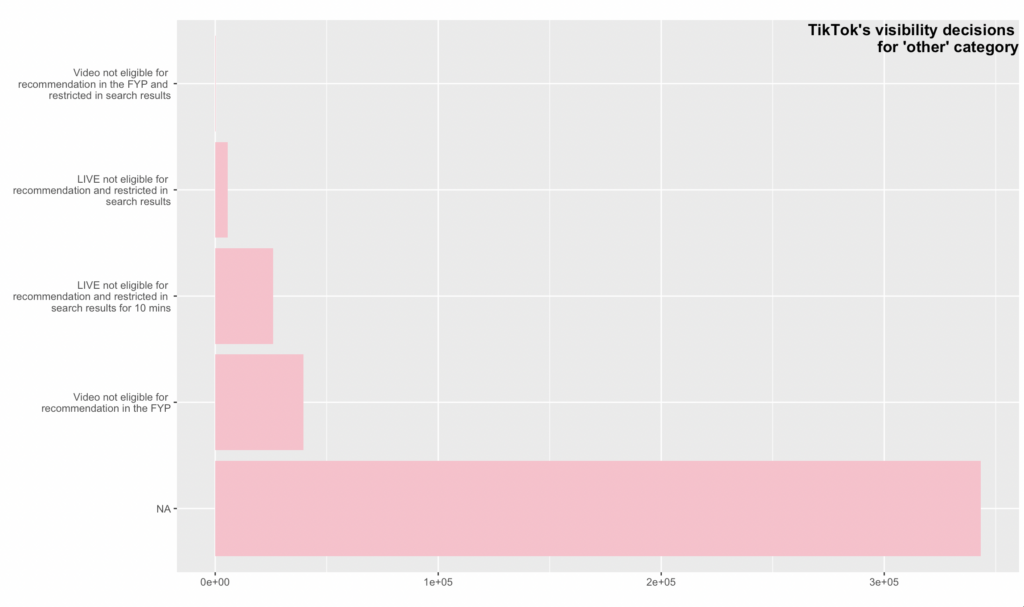
Figure 6 TikTok’s visibility decisions for the ‘other’ category
TikTok differentiates between live streams and videos in its visibility restrictions.
| platform_name | NA | Limited distribution | Mute audio | Ad approval limited |
| 193952 | 439036 | 1652 | 26 |
Table 7: Pinterest platform explanation of visibility decisions
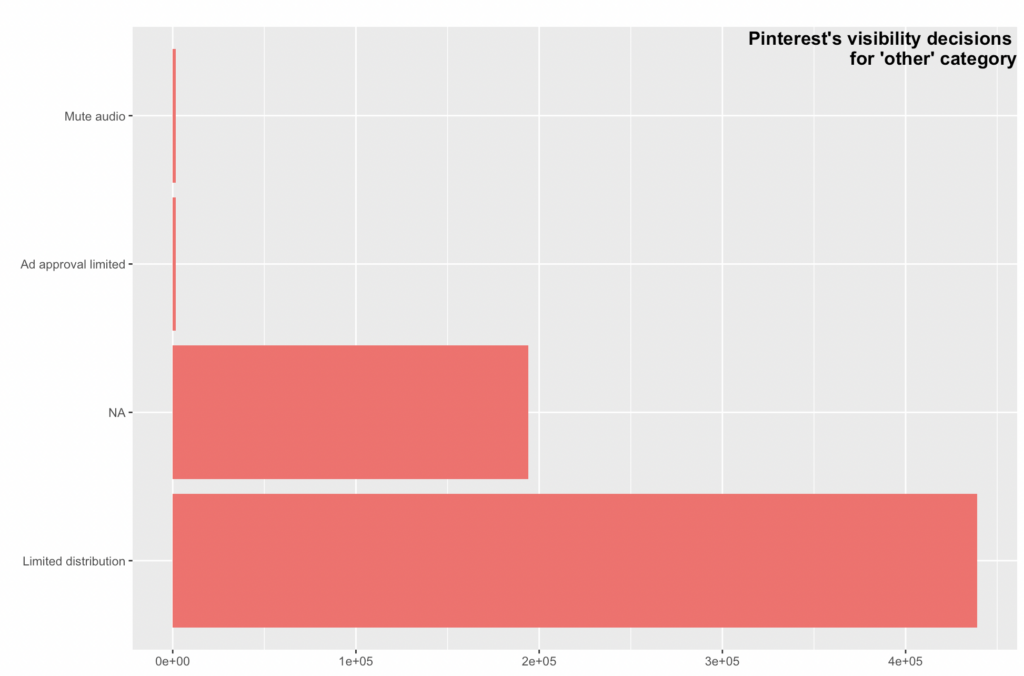
Figure 7 Pinterest visibility decisions for the ‘other’ category
Pinterterst has ‘limited distribution’ as the largest category of visibility restrictions
| platform_name | NA | Distribution limited to first-degree connections. |
| 283 | 49 |
Table 8: LinkedIn platform explanation of visibility decisions
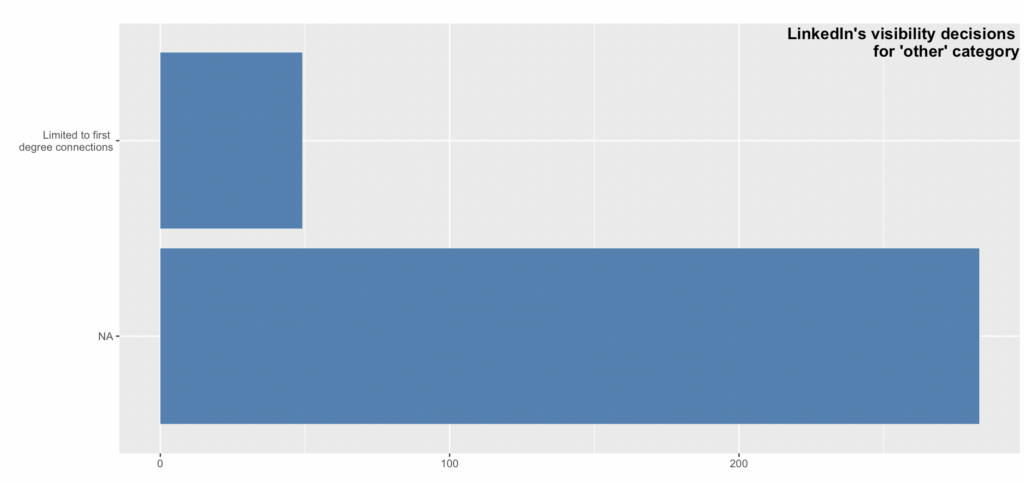
Figure 8: Visibility decisions for ‘other’ category reported by LinkedIn.
LinkedIn implements measures such as showing the content only to first-degree connections
Content type and category (or what kind of content was moderated?)
Another interesting category of variables is related to content, precisely content type and category. Eight categories of content type were reported, with the other content type leading in the reports among all platforms (table 10). In fact, roughly 1.5 million moderation cases were classified as other, with LinkedIn and Pinterest using this category solely (see Figure 9).
| Content type | N of cases |
| Other | 1483638 |
| Text | 282947 |
| Video | 172278 |
| Synthetic media | 164659 |
| Image | 92349 |
| Image, text and video | 26 |
| Audio | 7 |
| Product | 2 |
Table 9: Total amounts of content types reported as moderated by platforms.
| platform_name | OTHER | TEXT | SYNTHETIC_MEDIA | VIDEO | IMAGE | IMAGE,TEXT,VIDEO | AUDIO | PRODUCT |
| 659739 | 9625 | 132114 | 39082 | 62621 | 0 | 0 | 2 | |
| 634666 | 0 | 0 | 0 | 0 | 0 | 0 | 0 | |
| TikTok | 8075 | 272683 | 0 | 110341 | 23645 | 0 | 0 | 0 |
| YouTube | 100215 | 0 | 0 | 14472 | 0 | 26 | 0 | 0 |
| 77803 | 0 | 27168 | 2144 | 4264 | 0 | 0 | 0 | |
| Snapchat | 2808 | 639 | 0 | 6239 | 1819 | 0 | 0 | 0 |
| X | 0 | 0 | 5377 | 0 | 0 | 0 | 7 | 0 |
| 332 | 0 | 0 | 0 | 0 | 0 | 0 | 0 |
Table 10: content types reported as moderated by platforms
here are some minor yet interesting observations. For instance, X reports only audio and synthetic content while being known as a textual social media. Facebook is the only platform that defines the product content type, although in only two instances. YouTube, in contrast to other platforms, specifies a content type that is a combination of image, text and video (but only in 26 cases out of 114 713).
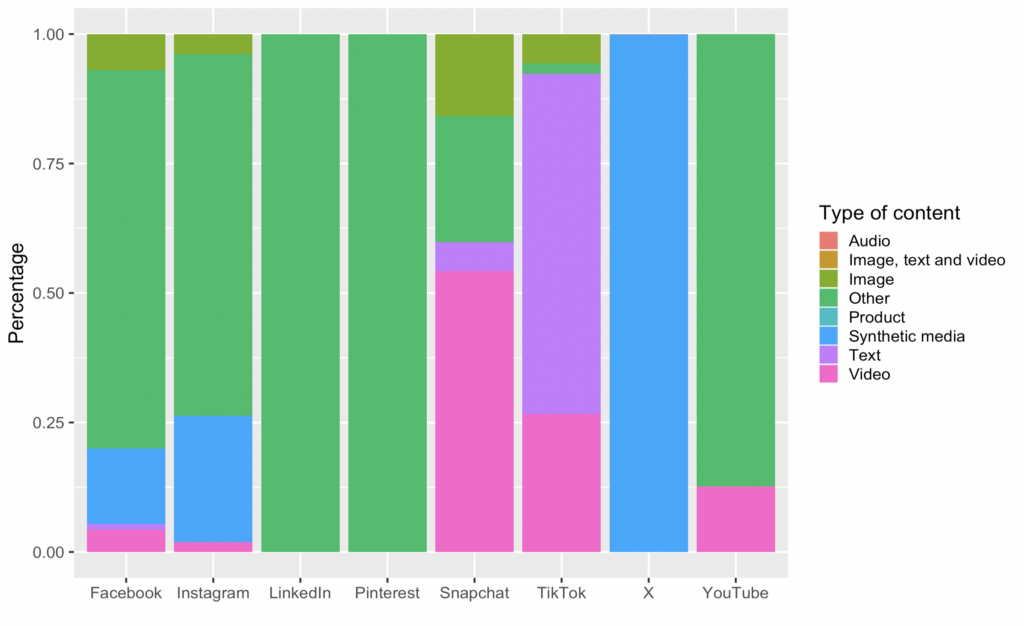
Figure 9: Proportion of different types of content by platform in %.
Partially, the ‘other’ type of content is then explained in another variable:
| platform_name | Account | Pin | NA | Content is an advertisement | Account Suspended | Account Ban | Profile information | Board | Multi-media | Ad | Merchant account | post | Content is a user account |
| 659739 | 0 | 243444 | 0 | 0 | 0 | 0 | 0 | 0 | 0 | 0 | 0 | 0 | |
| 0 | 633512 | 0 | 0 | 0 | 0 | 0 | 490 | 0 | 343 | 203 | 0 | 0 | |
| TikTok | 0 | 0 | 406669 | 0 | 5973 | 1423 | 678 | 0 | 0 | 0 | 0 | 0 | 0 |
| YouTube | 0 | 0 | 14498 | 100067 | 0 | 0 | 0 | 0 | 0 | 0 | 0 | 0 | 148 |
| 77803 | 0 | 33576 | 0 | 0 | 0 | 0 | 0 | 0 | 0 | 0 | 0 | 0 | |
| Snapchat | 2287 | 0 | 8697 | 0 | 0 | 0 | 0 | 0 | 391 | 0 | 0 | 0 | 0 |
| X | 0 | 0 | 5384 | 0 | 0 | 0 | 0 | 0 | 0 | 0 | 0 | 0 | 0 |
| 0 | 0 | 0 | 0 | 0 | 0 | 0 | 0 | 0 | 0 | 0 | 159 | 0 |
Table 11: Types of content moderated as ‘other’ (over 150 instances only)
It looks like platforms themselves define this variable, thus, there are so many descriptions of the ‘other’ content that is being moderated, specific to each platform.
Content category variable refers to the reason why this content was moderated
There were in total 14 categories of content which are also reported in the aggregated DSA database.
| platform_name | SCOPE_OF_PLATFORM_SERVICE | PORNOGRAPHY_OR_SEXUALIZED_CONTENT | ILLEGAL_OR_HARMFUL_SPEECH | DATA_PROTECTION_AND_PRIVACY_VIOLATIONS | VIOLENCE | INTELLECTUAL_PROPERTY_INFRINGEMENTS | PROTECTION_OF_MINORS | NEGATIVE_EFFECTS_ON_CIVIC_DISCOURSE_OR_ELECTIONS | SELF_HARM | SCAMS_AND_FRAUD | UNSAFE_AND_ILLEGAL_PRODUCTS | NON_CONSENSUAL_BEHAVIOUR | RISK_FOR_PUBLIC_SECURITY | ANIMAL_WELFARE |
| 690387 | 20489 | 13330 | 155761 | 17313 | 1634 | 1589 | 3 | 233 | 777 | 550 | 830 | 287 | 0 | |
| 487 | 592680 | 11767 | 57 | 16458 | 1775 | 2 | 5661 | 4810 | 29 | 875 | 22 | 43 | 0 | |
| TikTok | 141400 | 8092 | 208968 | 2303 | 39053 | 0 | 8937 | 431 | 2259 | 3038 | 0 | 0 | 0 | 263 |
| YouTube | 87747 | 0 | 0 | 55 | 0 | 26911 | 0 | 0 | 0 | 0 | 0 | 0 | 0 | 0 |
| 75306 | 7462 | 14305 | 13 | 9711 | 308 | 957 | 0 | 527 | 1793 | 405 | 486 | 106 | 0 | |
| Snapchat | 2921 | 2393 | 434 | 281 | 274 | 3 | 1331 | 224 | 22 | 1390 | 1200 | 811 | 221 | 0 |
| X | 109 | 2030 | 3 | 4 | 2628 | 18 | 421 | 0 | 30 | 48 | 68 | 24 | 0 | 1 |
| 225 | 7 | 81 | 0 | 8 | 2 | 0 | 7 | 0 | 0 | 0 | 0 | 2 | 0 |
Table 12: Types of content moderated – 14 categories by platforms
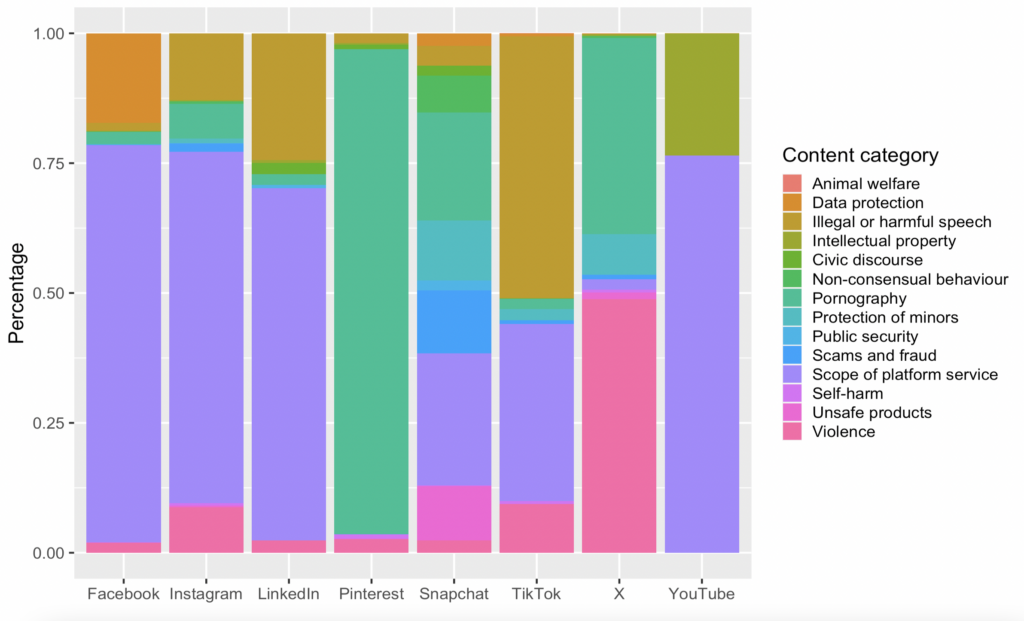
Figure 10: Proportion of different content categories by platform in %.
The most used category by many platforms (except for X and Pinterest) is, as in aggregated analytics, a vague ‘’scope of platform service’’ TikTok did not report any violations of intellectual property, but did report on illegal and harmful speech a lot more than other platforms. TikTok here did not report anything on unsafe or illegal products (as of 5th of November), although by the time this report was being written, it started a crack down on TikTok shops on copyright infringements. Pinterest’s majority of decisions were connected with the ‘pornography’ category.
YouTube, apart from scope of platform service and privacy, reported íntellectual property infringement as one of the most moderated categories. Which is not entirely surprising, given YouTube’s robust copyright moderation system (Dergacheva & Katzenbach, 2023).
Visibility decisions by content category: what moderation practices are more typical for certain categories of content?
| Removed | Disabled | Demoted | Age restricted | |
| Animal welfare | 168 | 0 | 0 | 0 |
| Data protection | 153432 | 274 | 0 | 0 |
| Illegal or harmful speech | 235056 | 208 | 881 | 24 |
| Intellectual property | 2432 | 26394 | 0 | 0 |
| Civic discourse | 249 | 223 | 0 | 54 |
| Non-consensual behavior | 970 | 448 | 0 | 0 |
| Pornography | 216451 | 180 | 10869 | 11 |
| Protection of minors | 6435 | 2 | 0 | 3755 |
| Public security | 251 | 194 | 0 | 0 |
| Scams and fraud | 3856 | 957 | 0 | 0 |
| Scope of platform service | 147797 | 11130 | 26769 | 5445 |
| Self-harm | 4696 | 22 | 0 | 6 |
| Unsafe products | 2308 | 197 | 96 | 0 |
| Violence | 57156 | 148 | 806 | 507 |
Table 13: Visibility decisions by content categories.
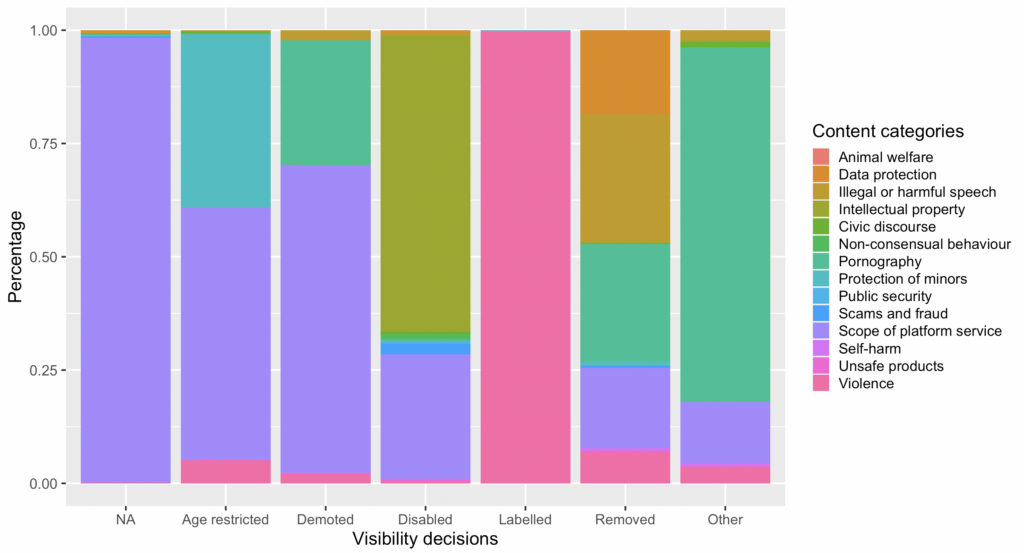
Figure 11: Proportion of content categories by visibility decision in %.
Chi-squared test shows that these two variables, content category and visibility decisions, are correlated. X-squared = 1656329, df = 65, p-value < 2.2e-16
For some content categories, removals were the dominant moderation practice as reported by platforms. This includes, for example, cases related to data protection, illegal or harmful speech, violence, unsafe products. Intellectual property cases were mainly disabled. It is also worth noting that most of the observations in the civic discourse content category are associated with other visibility decisions, while the majority of observations in the scope of platform service category are not classified.
Illegal or harmful speech
| platform_name | ILLEGAL_OR_HARMFUL_SPEECH |
| 13330 | |
| 11767 | |
| TikTok | 208968 |
| YouTube | 0 |
| 14305 | |
| Snapchat | 434 |
| X | 3 |
| 81 |
Table 14: Illegal or harmful speech reported by platforms
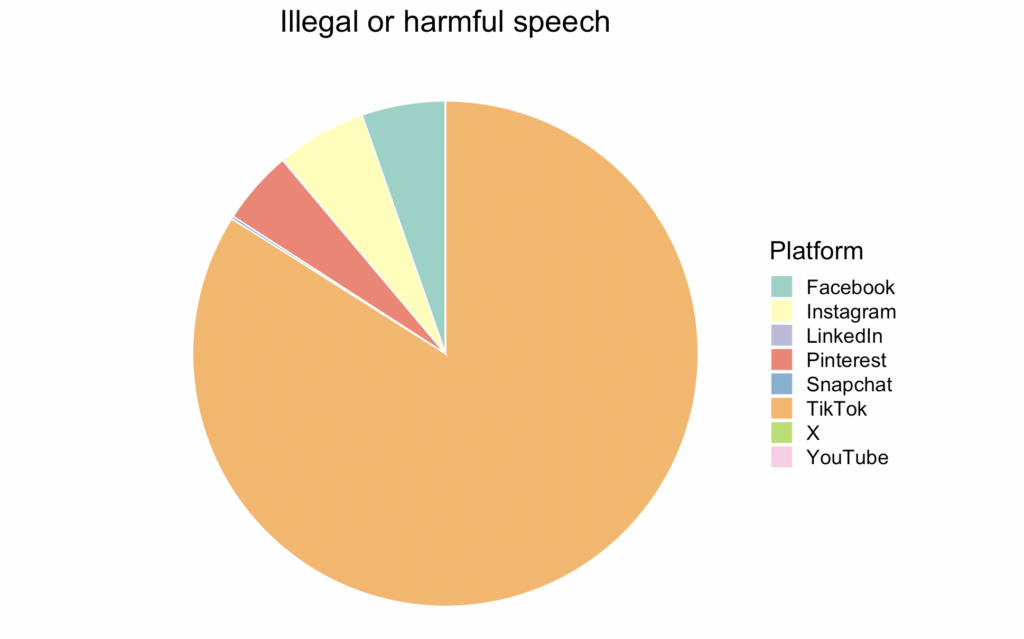
Figure 12: Illegal or harmful speech reported by platforms
TikTok had reported the most content in this category during the day.
X reported only 4 instances of this category of violations, and YouTube had 0.
Pornography or sexualized content
| platform_name | PORNOGRAPHY_OR_SEXUALIZED_CONTENT |
| 20489 | |
| 592680 | |
| TikTok | 8092 |
| YouTube | 0 |
| 7462 | |
| Snapchat | 2393 |
| X | 2030 |
| 7 |
Table 15: Pornography or sexualized content reported by platforms
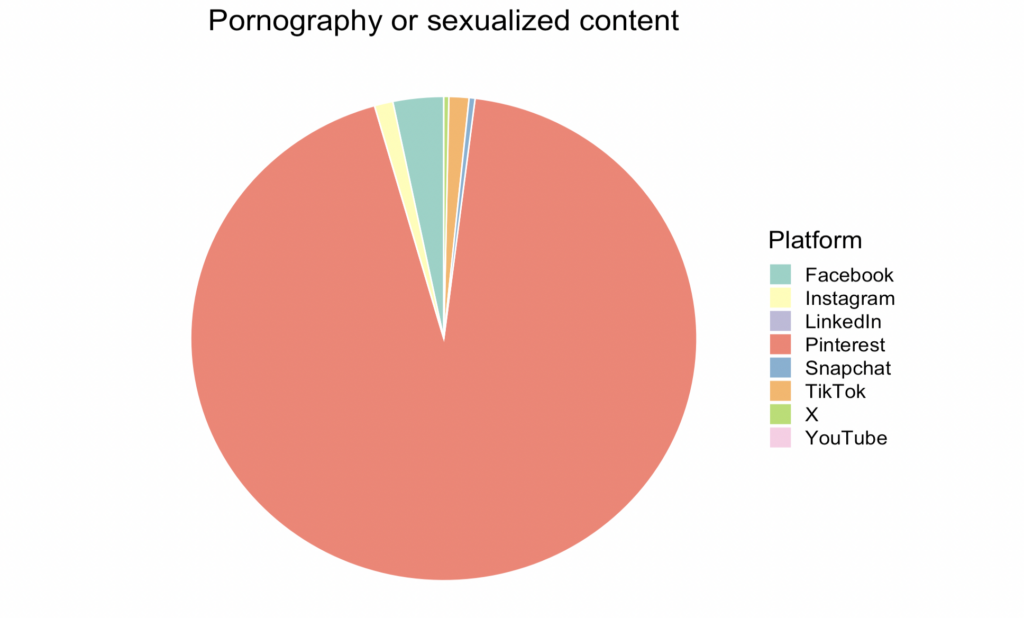
Figure 13: Pornography or sexualized content reported by platforms
Pinterest led the reports on this category during the day.
Violence
| platform_name | VIOLENCE |
| 17313 | |
| 16458 | |
| TikTok | 39053 |
| YouTube | 0 |
| 9711 | |
| Snapchat | 274 |
| X | 2628 |
| 8 |
Table 16: Violence reported by platforms
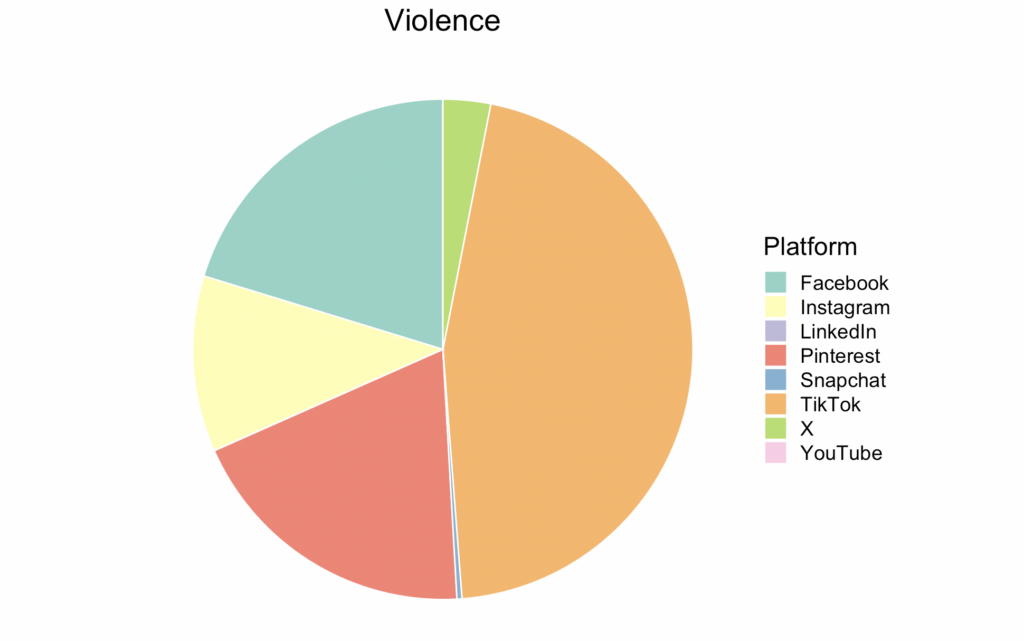
Figure 14: Violence reported by platforms, in %
Every platform except for YouTube reported some instances of violence with TikTok leading the reports in this category.
Intellectual property infringements
| platform_name | INTELLECTUAL_PROPERTY_INFRINGEMENTS |
| 1634 | |
| 1775 | |
| TikTok | 0 |
| YouTube | 26911 |
| 308 | |
| Snapchat | 3 |
| X | 18 |
| 2 |
Table 17: Intellectual property infringements reported by platforms
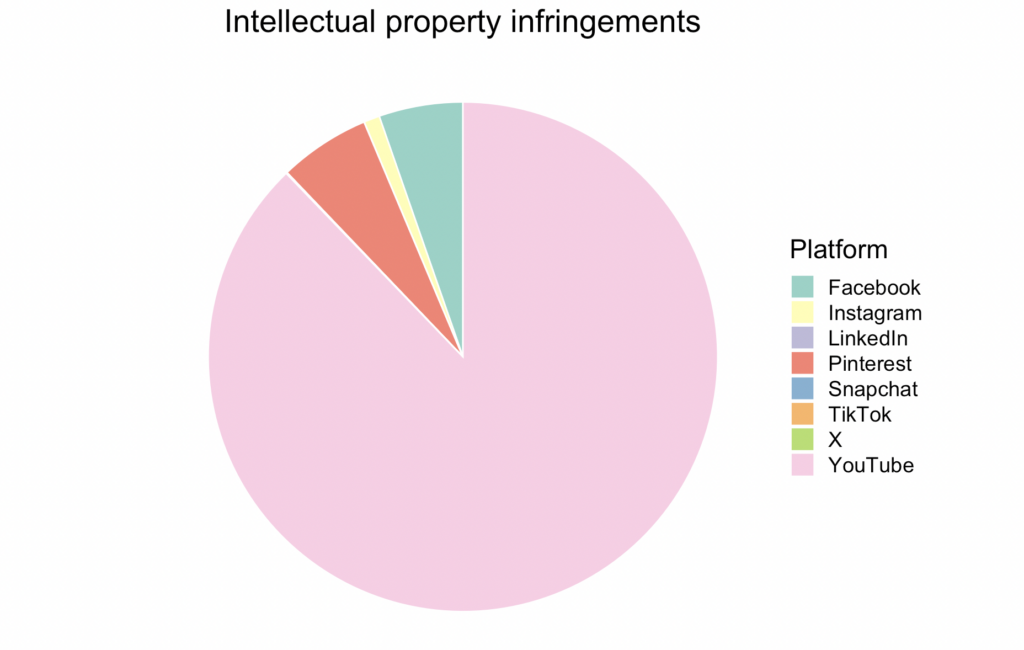
Figure 15: Intellectual property infringements reported by platforms, in %
YouTube reported the absolute majority of content moderated in this category. However, at least for this day, there were no monetary restrictions reported at all.
Keywords indicated by platforms as category for moderation
Keywords for moderation as reported by Pinterest platform
| platform_name | ADULT_SEXUAL_MATERIAL | HATE_SPEECH” | RISK_PUBLIC_HEALTH | MISINFORMATION | ONLINE_BULLYING_INTIMIDATION | REGULATED_GOODS_SERVICES | AGE_SPECIFIC_RESTRICTIONS_MINORS” |
| 592680 | 11767 | 3560 | 2101 | 22 | 26 | 1 |
Table 18: Keywords for moderation as reported by Pinterest platform
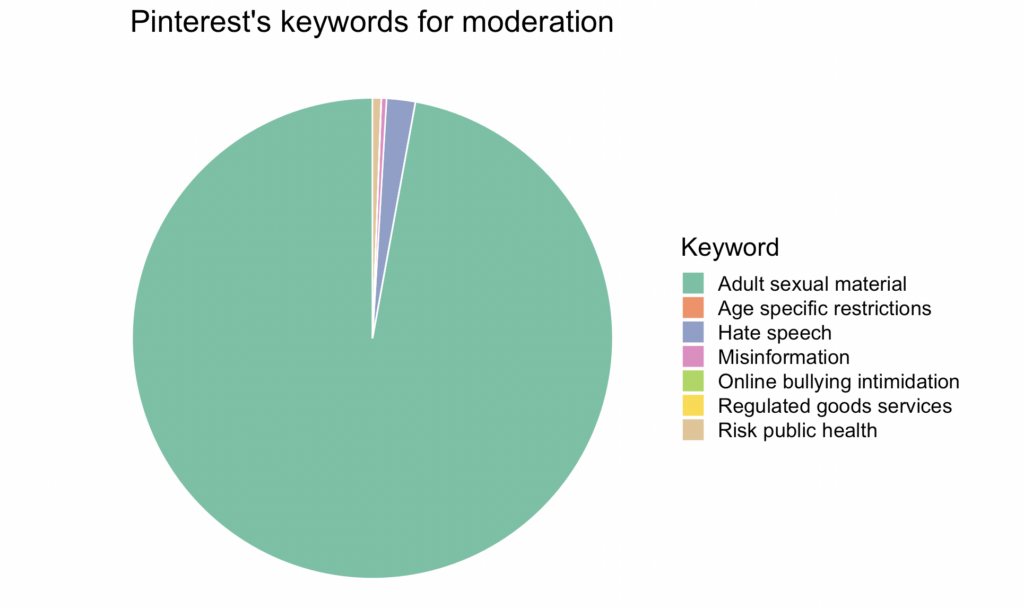
Figure 16 keywords for moderation by Pinterest
Pinterest and X were the only ones that specifically reported a ‘hate speech’ and ‘misinformation’ categories. For Pinterest, the numbers were 11767 instances of ‘’hate speech’ and 2101 ‘’misinformation’’. They have also reported 3560 instances of ‘’risk for public health’ which could also be connected to misinformation.
Keywords for moderation as reported by X platform
X reported 41 instances of misinformation and only 11 instances of hate speech for its reporting on November 5th 2023.
| platform_name | OTHER | RISK_PUBLIC_HEALTH | MISINFORMATION | ONLINE_BULLYING | GOODS_NOT_PERMITTED | SELF_MUTILATION | REGULATED_GOODS | GROOMING_SEXUAL_ENTICEMENT_MINORS | TRADEMARK_INFRINGEMENT | HATE_SPEECH | AGE_SPECIFIC_RESTRICTIONS_MINORS | HUMAN_TRAFFICKING | NON_CONSENSUAL_IMAGE_SHARING | NUDITY |
| X | 1825 | 2714 | 41 | 420 | 203 | 68 | 48 | 30 | 14 | 11 | 4 | 2 | 1 | 1 |
Table 19 Keywords for moderation as reported by X platform
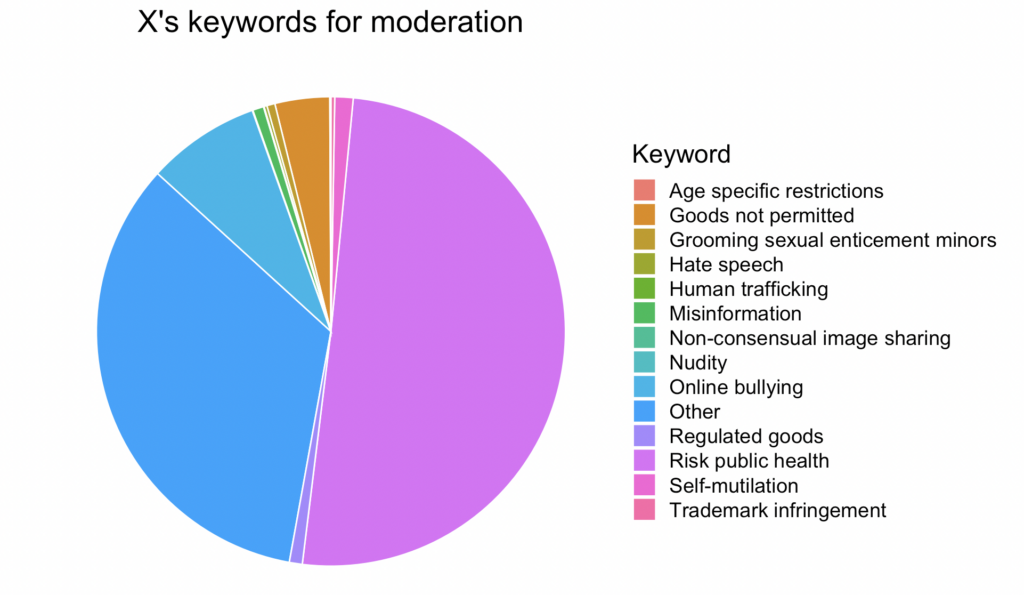
Figure 17: keywords for moderation by X
Sources for content moderation decisions
Most platforms declared voluntary moderation as the main ground, only X said it relied on notifications (not clear which ones, maybe from users), and YouTube indicated a large number of notifications, too, which is also probably in line with its robust copyright policy. Snapchat declared the most amount of content as reported under Article 16 (of the DSA).
| platform_name | SOURCE_VOLUNTARY | SOURCE_TYPE_OTHER_NOTIFICATION | SOURCE_ARTICLE_16 | SOURCE_TRUSTED_FLAGGER |
| 902998 | 0 | 185 | 0 | |
| 633912 | 754 | 0 | 0 | |
| TikTok | 413588 | 1156 | 0 | 0 |
| 111262 | 0 | 117 | 0 | |
| YouTube | 87443 | 26564 | 706 | 0 |
| Snapchat | 6611 | 1 | 4888 | 5 |
| X | 0 | 5384 | 0 | 0 |
| 259 | 0 | 73 | 0 |
Table 20: sources for content moderation decisions
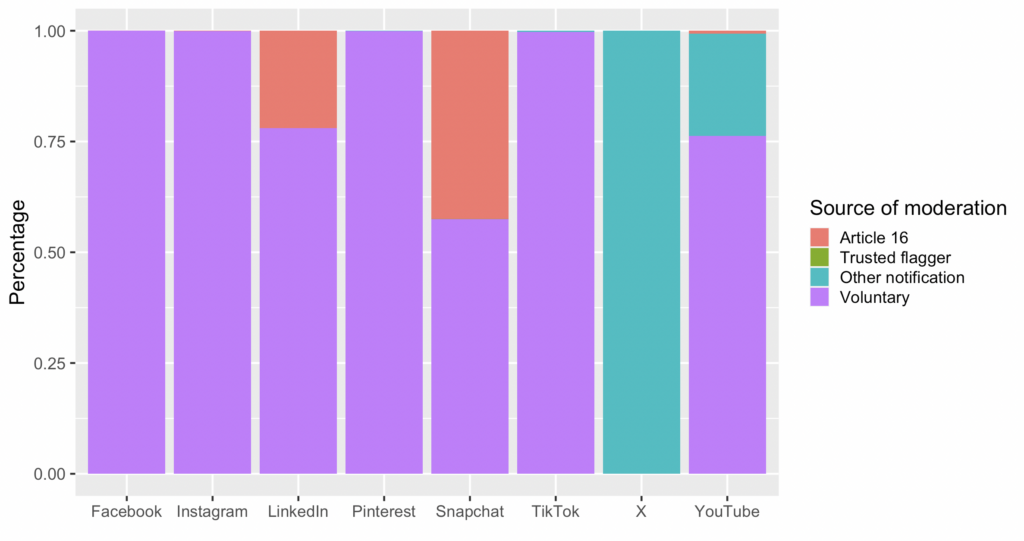
Figure 18: Proportion of moderation sources by platform, in %.
Trusted flaggers were not yet designated by the European Commission in November 2023. Article 16 of the DSA provides mechanisms for notice and complaint by users, and it is indeed used by platforms to some point, although not X, TikTok or Pinterest have indicated using it.
Duration of the suspension of services
This was only reported by TikTok and this measure lasted from one day to one week
| platform_name | 2023-11-12 | 2023-11-05 | 2023-11-08 | 2023-11-11 | 2023-11-06 | 2023-11-07 | 2023-11-09 | 2023-11-10 |
| TikTok | 1700 | 900 | 448 | 38 | 23 | 11 | 3 | 2 |
Table 21: duration of the suspension of services
Date of moderated content creation
Most of the content analyzed for this report was generated within the two days preceding the reporting date. However, it’s important to note that there were numerous instances where the content dated back to earlier years. Specifically, some of the content moderation decisions reported on November 5th were associated with material created in the early 2000s. For example, Facebook reported moderating over 10 000 pieces of content for the year 2018, while YouTubeaddressed content dating back to 2006.. This might be that Facebook indicated accounts as moderated, too, and in this case, accounts could be created at the date indicated. Instances of moderating old content were also present with YouTube, Pinterest, and Snapchat. and TikTok content moderation decisions went back to content created several months ago, and LinkedIn’s decisions concerned content created several days ago. X did not report any old content moderated.
Some ot the earliest dates include :
2000-01-01, 2006-08-23, 2006-09-02, 2006-09-04, 2006-09-28
And the latest dates reported were:
2023-11-01, 2023-11-02, 2023-11-03, 2023-11-04, 2023-11-05.
Territorial scope of decisions on moderated content
Most of the decisions applied were specified as valid for all EU member states.
However, YouTube and X also reported content decisions for which applied for specific countries only, such as Germany and France for both, and also Austria, Denmark and Italy in some cases for YouTube (see Table 22).
| platform_name | Country | count |
| YouTube | [“DE”] | 4319 |
| YouTube | [“FR”] | 2542 |
| YouTube | [“AT”,”DE”] | 1844 |
| YouTube | [“IT”] | 1303 |
| X | [“DE”] | 1220 |
| X | [“FR”] | 992 |
Table 22: territorial scope of decisions
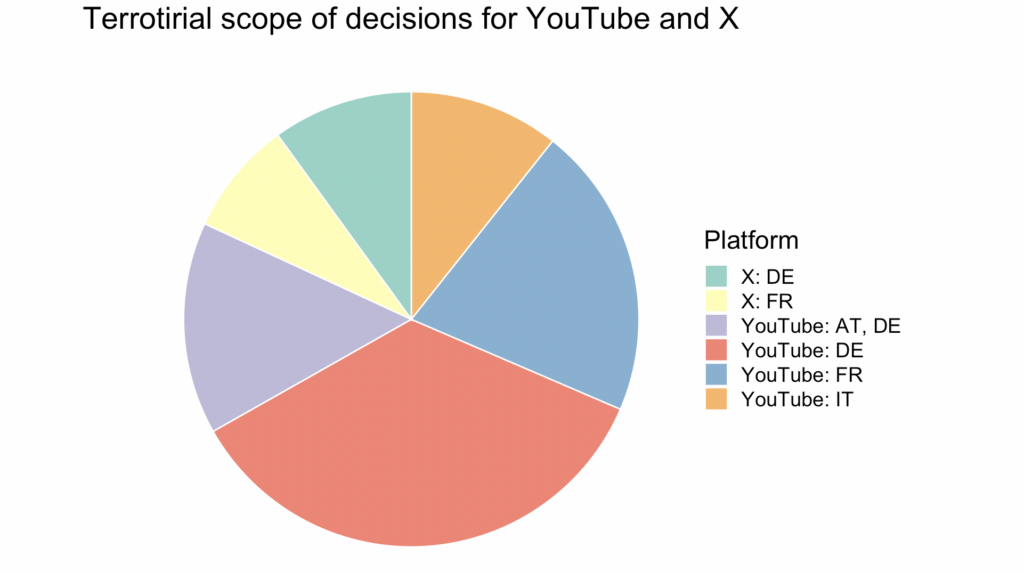
Figure 19: Territorial scope of decisions for YouTube and X, other than ‘all EU member states’
Conclusion
In spite of the fact that the DSA transparency database provides aggregated analytics on decisions, it does not provide all the information that platforms submit. But digging in the particular day of content moderation adds many interesting layers of content moderation. For example, aggregated statistics only shows several categories of reasons for content moderation, and the largest of them is an opaque ‘’scope of platform service’ category. While it is possible to see keywords as aggregated statistics, it is not possible to see them by platform, unless one looks at the everyday reports. In addition, a lot of content which is identified as ‘illegal or harmful speech’ (be it misinformation or hate speech) is aggregated into one category. However, the actual daily reports (and perspectively, probably, API access to the database) can show more specific decision grounds, although not for all social media platforms.
The Lab “Platform Governance, Media and Technology” at the Center for Media, Information and Communication Research (ZeMKI), University of Bremen, will continue studying content moderation reports provided under the DSA, creating a longitudinal study. In light of the EU Commission’s call to a public consultation to gather feedback on the Implementing Regulation on the templates that intermediary services and online platforms will have to use for their future transparency reports under the Digital Services Act (DSA), we hope that this report helps to understand what is currently lacking in content moderation decisions reporting of the very large digital platforms in the EU. We invite other individual researchers and research groups for cooperation on assessment of DSA’s effect on governance by platforms.
Bremen, December 10, 2023.
Dergacheva, Daria; Kuznetsova, Vasilisa; Scharlach, Rebecca; Katzenbach, Christian.
Photo by Campaign Creators on Unsplash
